
RED WOLF RELIABILITY
Papers and Case Studies
Back to Basics - Recognition of Bad Data
The best part of being a vibration analyst to me is the opportunity to troubleshoot many different types of equipment and always being challenged with new and interesting problems to solve. However, for many vibration analysts there is a large amount of data to be processed between those interesting problems. Ideally, a robust platform is in place with effective statistical alarms that is sorting through the bulk of the data and bringing to forefront what needs an analyst’s attention. I am routinely reminded this is not always the case as many databases are littered with bad data. So, let’s get back to basics and discuss an example of how to spot bad data.
In your introductory training to vibration analysis, I’m sure you were exposed to the textbook example of the “ski slope” or first bin error easily identified in a spectrum. Figure 1 shows an example of bad data as indicated by the high amplitude at the far left of the spectrum which is the first bin. Note the amplitude of the first bin is nearly 0.4 in/sec. This is likely to cause an alarm condition for many types of equipment. If you see this in your data it is important you remove it from the database so it does not affect the overall trends, waterfall plots, and potentially get included in alarm calculations or automated algorithms.
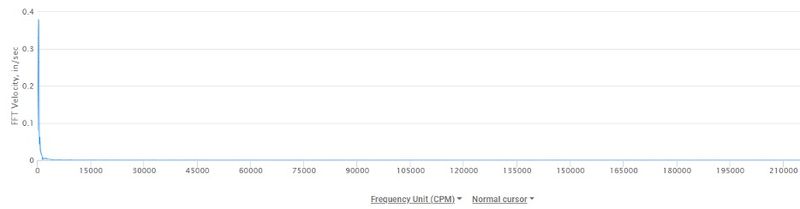
Figure 1. First bin error or what is commonly referred to as a "ski slope" indicating bad spectral data.
It is important to go one step further after finding you have bad spectral data and try to determine why. This is where the time waveform comes in very handy and may be able to provide the information needed to answer that question. Figure 2 shows the time waveform which was responsible for the first bin error in the previous spectrum. Looking at the waveform we can see a downward drift of the signal which is being caused by a change in the accelerometer’s bias voltage. This is many times caused by saving data before the sensor has settled but can also indicate other sensor power issues. I would recommend recollecting the data and allowing for more settling time. If this does not solve your problem, check all connectors and cabling for damage. If the connectors and cabling check out, verify your sensor is good.
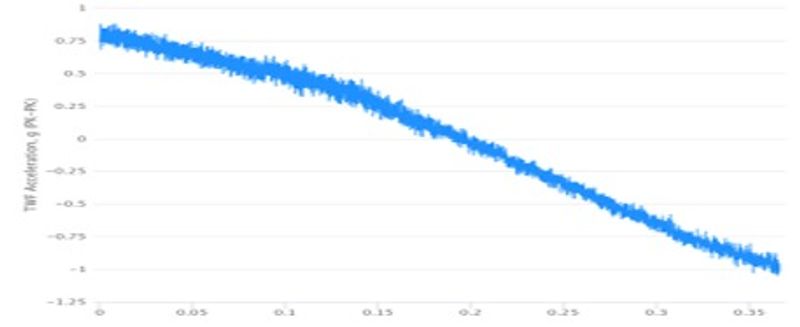
Figure 2. Time waveform showing a significant shift in the bias voltage over time.
The time waveform is also a very useful tool for identifying bad data because sometimes the data looks so weird we know that it isn’t valid data. Figure 3 is a great representation of this instance. The shift from a partially sinusiodal to a square pulse waveform doesn’t occur in our rotating equipment. This illustrates a sensor/data acquistion issue of the waveform.
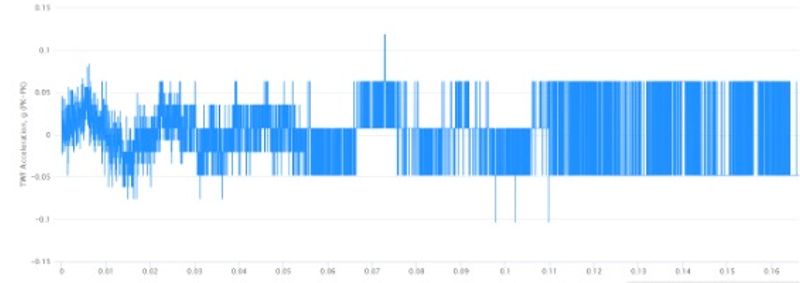
Figure 3. Bad data as represented in a time waveform from an accelerometer used for an online system.
There are other causes of bad data and depending on your sensor they may not be as apparent as these examples. If you suspect you have bad data but need help figuring out the problem reach out to us at Red Wolf Reliability.