Red Wolf Reliability
Papers and Case Studies
Field Balancing: Balancing Out the Root Cause
Analyzing only vibration response spectra is difficult since they often don't clearly match wall chart and textbook examples.
Take for example the force of unbalance. Wall charts and texts on vibration analysis represnt mass unbalance as a running speed peak in the spectrum that dominates all other content. Also, these theoretical, or textbook, examples indicate the vibration amplitudes will be equal in the horizontal and vertical planes. However, experienced vibration analysts know this is often not the signature we see. This is due to the fact there are multiple forces acting on the system, and it may have asymmetric stiffness resulting in highly directional vibration. In these situations, following the wall chart examples without additional phase analysis may send an analyst down the wrong path. In order to be effective in vibration analysis, it is necessary to first resolve the most dominant problem and then reanalyze the machine to determine if there are any further forces that need to be minimized. Properly identifying the most dominant problem can be difficult, so make sure to use all tools available. This case history illustrates a situation in which the vibration signature was far from being textbook due to multiple sources simultaneously acting on the system to produce one on-textbook signature. Getting to the root causes of the problem took multiple iterations.
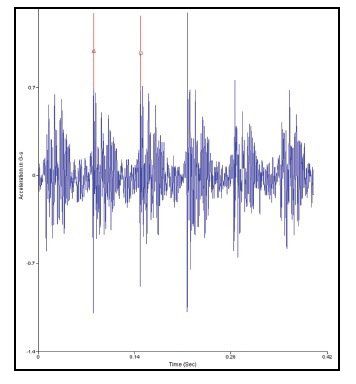
Fig. 1 Time waveform taken at outboard fan bearing showing impacts once per revolution.
Loose Bearing in the Housing
A 6-foot-diameter, double-suction centrifugal fan that is driven by a 250 hp electric motor shut down as a result of high vibration on the outboard fan bearing. Additional data was collected with a portable analyzer that showed low overall amplitudes of vibration of 0.12 ips (pk). Since the overall vibration switch was part of an old monitoring system, the integrity of the switch was tested and was found to be working properly. Plant personnel suspected the passing of a nearby train could be causing the high vibration, so it was investigated and ruled out as a possibility. Spectra and time waveforms analyzed showed multiple harmonics within the spectrum and an elevated noise floor, indicating a loose condition at the outboard bearing location. No problems were found in the bolted and welded connections, so it was suspected the bearing was loose in the housing due to wear. The bearing housing cap was removed, and inspection revealed skid marks on the outer diameter of the outer bearing race, indicating the bearing had indeed spun inside the housing and was loose. Both the bearing and housing were replaced, and the motor was realigned.
Data collected after the bearing and housing were replaced showed the vibration amplitudes had increased slightly to 0.15 ips (pk). This was not a surprise since the new bearing and housing now had a proper fit, which resulted in a solid transmission path of forces from the fan to the case-mounted accelerometer. Additionally, if the bearing housing became worn enough for the bearing to spin in the housing, an excessive force had to be present to cause the wear to occur.
In all situations where the diagnosis is looseness, there must be an underlying cause for the looseness to occur. Looseness is only an aggravating condition and therefore must have an underlying cause that leads to the looseness. In most cases, looseness develops over time as a result of excessive force acting on the system components.
Interference and Poor Performance
Figure 1 depicts time waveform readings taken after the new bearing housing and bearing were installed. They reveal an impact occurring once per revolution.
It was suspected that there was interference between stationary and rotating parts within the fan. After opening up the fan, the interference problem between the fan wheel and the inlet cone was apparent. There was excessive overlap between the fan wheel and the inlet cone, which resulted in very tight clearances. Corrosion of the inlet cone over time caused it to distort, resulting in contact between the fan wheel and inlet cone. Additionally, it was noticed that repairs over the many years of service to the opposite inlet cone had led to the opposite problem. There was a substantial gap between the inlet cone and the fan wheel, which can significantly decrease performance of the fan.
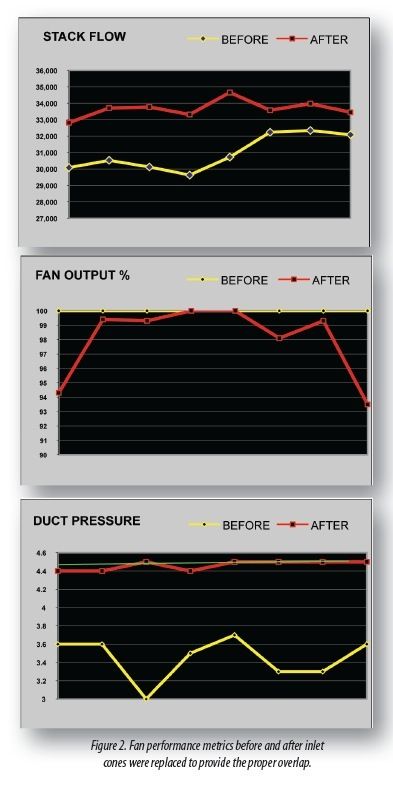
An immediate fix to the interference was implemented, and it was recommended that the plant have both inlet cones cut out and replaced to provide the proper overlap. The work was scheduled at a later opportunity to have the old inlet cones that were corroded and distorted cut out and replaced with completely new sections on either side. This work was performed by the fan OEM. The new inlet cones provided the proper clearance between the wheel and the stationary inlet cone section, which eliminated the interference problem, as well as substantially increased the performance of the fan. Prior to putting in the new inlet cones, operators were continuously running the fan at 100% output and still not achieving the desired pressure set point. After the fan inlet cones were replaced, operators only occasionally were required to run the fan at 94% output to achieve the desired set point, as is shown in Figure 2. The increase in performance achieved was a 12% increase in stack flow and over a 20% increase in duct pressure. As shown in the duct pressure plot in Figure 2, the desired duct pressure set point (green line) was able to be held, given the increase in fan performance.
Dynamic Balancing
The follow-up phase analysis showed the dominant force was a rotating force and more specifically was a static unbalance. However, the spectral and time waveform port this per wall chart/textbook criteria. The spectra had low amplitudes of vibration at the 1X running speed and did not dominate other content in the spectrum. Additionally, the horizontal and vertical amplitudes were not similar as analysts are taught to expect. Knowing that spectral data and amplitudes can be misleading, the decision to balance the fan was made using the phase analysis alone. Relative motion analysis using phase information is usually more accurate than spectral amplitudes in the diagnosis of the dominant force acting on the system. Using relative motion phase analysis to determine whether the dominant force is rotating or stationary helps to pinpoint the possible problems.
Since phase analysis showed the relative motion of the rotor to be "in-phase" end-to-end, the dominant unbalance condition was determined to be static. Therefore, a single plane balancing procedure was performed. The fan wheel was thoroughly cleaned before balancing was performed, and it was noted that a significant amount of balancing weight was already present on the wheel. Three corrections were performed, which resulted in the removal of previous correction weights totaling 24.17 ounces. It is always a best practice when balancing to have the least amount of additional weight on the rotor as possible. This can be accomplished by removing or modifying old correction weights if they are mounted close to the proper location for weight removal. Modern portable analyzers, such as the VibXpert used in this case, often have the capability to toggle between weight addition and removal. Another way to minimize the amount of weight is to combine multiple weights into one. A combination of two weights at different angles will always combine to make one with less total weight.
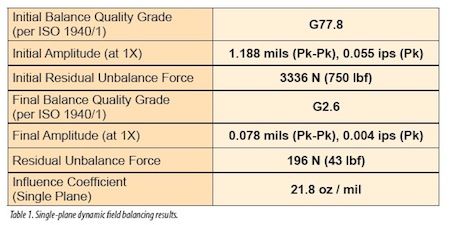
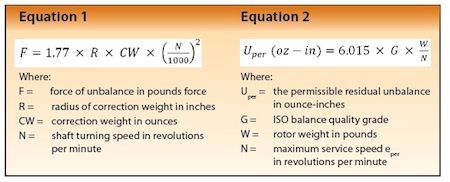
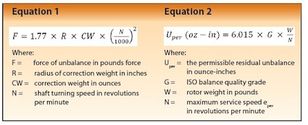
The balancing results are summarized in Table 1. The force due to the unbalance mass that was removed equaled 707.5 lbf at the running speed of 884 rpm. This was calculated using Equation 1 (listed above) with a correction radius of 33 inches and the vector combination of weight of 15.5 ounces.
Even though the amplitudes of vibration were low, and the spectral data did not indicate a dominant unbalance problem, there clearly was an excessive force due to unbalance. The reason for the lack of 1X running speed frequency response in the spectrum is a result of the system on which the forces were acting. This is apparent when reviewing the influence coefficient in Table 1. It took a significant amount of mass to cause a change in the response amplitude. In this case, this is because both the motor and fan have a very robust support structure and are securely attached to a large inertia base, which does a very good job of resisting vibration. In the process of properly balancing the fan, the root cause of the looseness in the bearing housing was identified and solved.
When balancing a rotor, it is very important to balance to balance quality grades and not simply response amplitudes. If only amplitudes were considered in this case, balancing would have not been performed, due to the very low amplitudes of vibration. The ISO 1940/1 standard outlines the balance quality requirements for rigid rotors. Industrial fans need to be balanced to within an ISO G6.3 balance quality grade or better. Since the balance quality grade is directly proportional to the amount of residual unbalance, achieving a better balance quality will decrease the force due to unbalance on the bearings and significantly increase the overall bearing life. The ISO 1940/1 standard includes a chart to determine the balance quality grade, or it can be calculated using Equation 2 (listed on the left). Again, the modern portable analyzers make balancing much easier for users, and some will calculate the balance quality grade as well as the residual unbalance force (Figure 3).
Conclusion
Analyzing only vibration response spectra is difficult since they often don't clearly match wall chart and textbook examples. This requires vibration analysts to utilize multiple vibration analysis techniques to get the whole picture, which may lead to solving multiple problems. The end result should solve the root cause of the problem, which leads to increased reliability. Here are a few things to consider for this type of difficult problem:
- Utilize advanced techniques, such as phase and time waveform analysis, to ensure that the system's response does not mask the true root cause.
- Consider the system analyzed and ask a few questions:
- What kind of response would this system exhibit given how it is supported, adjacent equipment that is running, current operating state, etc.?
- Could there be an aggravating condition such as looseness, resonance, or beating that is masking the real problem?
- Identify aggravating conditions first, fix the aggravating condition, and then reanalyze the system and repeat until all issues have been resolved.
- Do not attempt to solve fundamental problems such as unbalance and misalignment with aggravating conditions present. Such attempts may immediately result in excessive vibration, or the vibration will return in the future, causing additional problems.
- Multiple faults may be present. Identify and resolve the most dominant problems first. Then reanalyze the system and repeat until all issues have been resolved.
- Balancing is performed to reduce the amount of residual unbalance force in the rotor. It is not sufficient to balance to a given amplitude without knowing the influence of unbalance mass to the particular machine.
- Always balance to ISO, MIL-STD, or API balance tolerances.
Chad Wilcox, MSME, provides vibration analysis solutions and training for clients across the United States and overseas. He is certified Category III by The Vibration Institute. Mr. Wilcox is currently the Executive Director of Business Development for Red Wolf Reliability (formerly Pioneer Engineering), located in Fort Collins, Colorado.